English text is here.
![]()
![]()
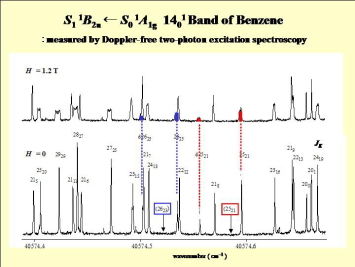 |
Figure 1. Doppler-free two-photon excitation spectra of benzene at the magnetic field H = 1.2 T (upper trace) and H = 0 T (lower trace). Assignments of the Q(K)Q(J) lines are indicated as JK. Remarkable Zeeman splittings (broadenings) are observed for K=J lines. The blue and red lines shows the perturbed and perterbing levels for 2521 and 2623, respectively. Arrows are indicated the calculated (unperturbed) line positions. |
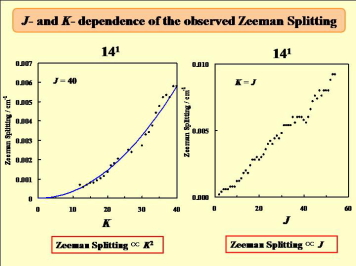 |
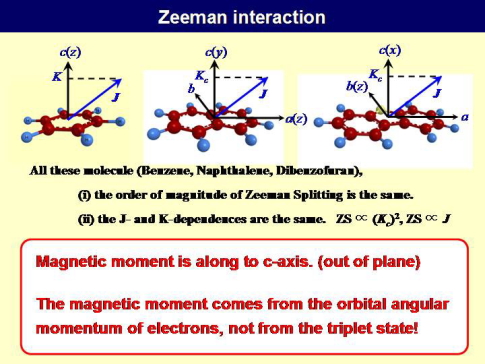
Figure 2. (left) K-dependence of the observed Zeeman splittings of the Q(K)Q(40) lines at H=1.2T. (right) J-dependence of the observed Zeeman splittings of the Q(K=J)Q(J) lines at H=1.2T. |
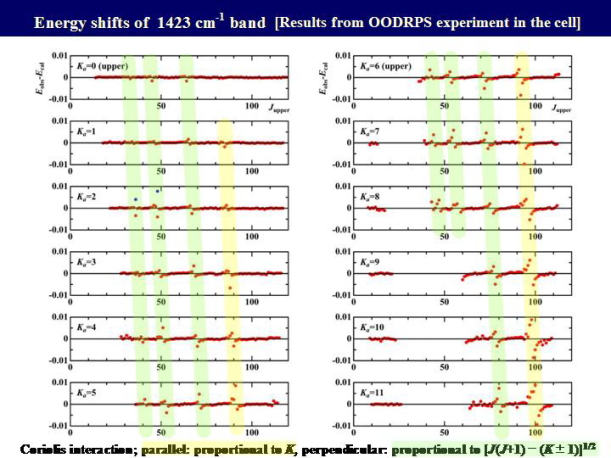 |
Figure 3. The difference between the observed transition energy Eobs and the energy Ecal calculated from the obtained molecular constants is plotted for the rPKa(J) line (Ka=0-9). |
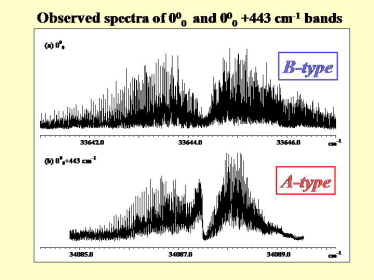 |
Figure 4. Ultrahigh-resolution fluorescence excitation spectra of the a) 000 and b) 000 + 443cm-1 bands of the S1 ← S0 transition of dibenzofuran in a collimated molecular beam. |
 |
![]()